Friday, May 16, 2014

Fussing about PERT and Monte Carlo methods


A note from a reader of some of my stuff on slideshare.net/jgoodpas:
"... I just read your slide presentation on using stats in project management and am a bit confused or perhaps disagree ... that using Monte Carlo will improve the accuracy of a schedule or budget based on subjective selections of activity or project
a) optimistic, realistic and pessimistic ($...Time) values,
b) a probability distribution (3 point triangular) and
c) arbitrary probability of occurrence of each value.

If I understand your presentation Central Limit Theory (CLT) and the Law of Large Numbers (LLN) when applied using Monte Carlo simulation states that accuracy is improved and risk more precisely quantified.

It seems to me that this violates a law that I learned a long time ago...garbage in-garbage out. Is this true? ...."
I replied this way about accuracy:
  • Re 'accuracy' and MC Sim (Monte Carlo simulation): My point is (or should have been) the opposite. The purpose of MC Sim is to dissuade you that a single point estimate of a schedule is "accurate" or even likely. Indeed, a MC Sim should demonstrate the utility of approximate answers
  • Project management operates, in the main, on approximations... ours is the world of 1-sigma (Six Sigma is for the manufacturing guys; it doesn't belong in PM).
  • Re the precision/accuracy argument: My favorite expression is: "Measure with a micrometer, mark with chalk, and cut with an axe", implying that there is little utility in our business (PM) for precision, since most of our decisions are made with the accuracy of chalk or axes.
  • A MC Sim gives you approximate, practical,and actionable information about the possibilities and the probabilities (all plural) of where the cost or schedule is likely to come out.
  • And, to your point, the approximate answers (or data) should be adequate to base decisions under conditions of uncertainty, which is for the most part what PMs do.
So, what about MC Sim itself?
  • Re your contention: " ... selecting the distribution, optimistic, pessimistic and realistic values must be accurate for Monte Carlo to provide more accurate results." Actually, this contention is quite incorrect and the underlying reason it is incorrect is at the core of why a MC Sim works.
  • In a few words, all reasonable distributions for describing a project task or schedule, such as BETA (used in PERT), Normal (aka Bell), Rayleigh (used in many reliability studies, among others), Bi-nominal (used in arrival rate estimates), and many others are all members of the so-called "exponential family" of distributions. You can look up exponential distributions in Wikipedia.
  • The most important matter to know is that, in the limit when the number of trials gets large, all exponentials devolve to the Normal (Bell distribution).
  • Thus, if the number of trials is large, the choice of distribution makes no difference whatsoever because everything in the limit is Normal.
  • If you understand how to do limits in integral calculus, you can prove this for yourself, or you can look it up on Wikipedia
How large is large?
It depends.
  • As few as five sometimes gives good results (see image) but usually 10 or more is all you need for the accuracy needed for PM.
  • Consequently, most schedule analysts pick a triangular distribution, which does not occur in nature, but is mathematically efficient for simulation. It is similar enough to an exponential that the errors in the results are immaterial for PM decision making purposes.
  • Some other picks the uniform distribution like shown in the image; again for mathematical convenience
Should I worry about 'when' and 'where'?
  • Now the next most important matter to know is that a sum of exponentials (BETA, Rayleigh, whatever) -- like would be the case of a sum of finish-to-start tasks -- has the same effect as a number of trials.
  • That is, if the project is stationary (does not matter when or where you look at it), then a string of repeated distributions (as would be in a schedule network) has the same characteristics as a single distribution tried many times.
  • And, each member of the string not be the same kind of distribution, though for simplicity they are usually assumed to be the same.
  • Thus, whether it's one distribution tried many times, or one distribution repeated many times in a string of costs or tasks, the limiting effect on exponentials is that the average outcome will itself be a random variable (thus, uncertain) with a distribution, and the uncertainty will be Normal in distribution.
And, about that garbage
  • The usual statement about GIGO assumes that all garbage has equal effect: Big garbage has big effects; and little garbage has little effects; and too much garbage screws it all up.
  • This is certainly the case when doing an arithmetic average. Thus, in projects, my advice: never do an arithmetic average!
  • However, in a MC SIM, all garbage is not equal in effect, and a lot of garbage may not screw it up materially. The most egregious garbage (and there will be some) occurs in the long tails, not in the MLV.
  • Consequently, this garbage does not carry much weight and contributes only modestly to the results.
  • When I say this I assume that the single point estimates, that are so carefully estimated, are one of the three estimates in the MC Sim, and it is the estimate that is given the largest probability; thus the MLV tends to dominate.
  • Consequently, the egregious garbage is there, has some effect, but a small effect as given by its probability.

What about independence and correlations?
  • If the distributions in the MC Sim are not independent then results will be skewed a bit -- typically, longer tails and a less pronounced central value. Independence means we assume "memoryless" activities, etc so that whether a string of tasks or one task repeated many times, there is no memory from one to the other, and there is no effect on one to the other other than in finish-to-start there will be effects on the successor start time.
  • Correlations are a bit more tricky. In all practical project schedules there will be some correlation effects due to dependencies that create some causality.
  • Again, like loss of independence, correlation smears the outcome distribution so that tails are longer etc.
  • Technically, we move from the Normal to the "T" distribution, but effects are usually quite inconnseqential. 
Where to get the three points if I wanted them?
  • My advice is in the risk management plan for the project, establish a policy with two points:
    1. All tasks on the calculated single point critical path will be estimated by experts and their judgement on the task parameters go in the sim
    2. All other tasks are handled according to history re complexity factors applied to the estimated MLV (most likely value, commonly the Mode): that is, once the MLV for a non-critical task is estimated, factors set by policy based on history, are applied to get the estimates of the tails.
  • Thus, a "complex task" might be: optimistic 80% of MLV and pessimistic 200% of MLV, the 80% and 200% being "policy" factors for "complex" tasks.
  • This is the way many estimating models work, applying standard factors taken from history. In the scheduling biz, the issue is not so much accuracy -- hitting a date -- as it is forecasting the possibilities so that some action can be taken by the PM in time to make a difference.
  • Providing that decision data is what the MC Sim is all about. No other method can do that with economic efficiency

PERT v MC Sim
Now, if the schedule is trivial, there is no real difference in the PERT and MC Sim. Take, for example, a dozen tasks in a tandem string of finish-to-start.
  • The PERT answer to the expected value of the overall duration and the MC Sim will be materially identical.
  • The sum of the expected values of each task is the expected value of the sum. So, the SIM and the PERT give identical answers insofar as an "accurate" expected value.
  • But that's where it ends. PERT can give you no information about the standard deviation of the outcome (the standard deviation contains the reasonable possibilities about which you should be worried), nor the confidence curve that lets you assess the quality of the answer. 
  • If your sponsor asks you run the project with an 80/20 confidence of finishing on time, where are you going to go for guidance? Not to PERT for sure.
  • And, if your sales manager says bid the job at 50/50, you have the same issue... where's the confidence curve going to come from?
  • And, most critically: PERT falls apart with any parallelism in the schedule in which there is no slack.
Thus, some 30 years ago PERT was put on the shelf, retired by most scheduling professionals

I'm almost out of gas on this one, so I'll end it here.


The image shows the outcome of 5 independent uniform distribution summed, as in a finsh-to-start schedule sequence.


Read in the library at Square Peg Consulting about these books I've written
Buy them at any online book retailer!
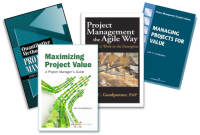
http://www.sqpegconsulting.com
Read my contribution to the Flashblog

Wednesday, May 14, 2014

Fix the architecture or the leaky windows?


One of the agile principles is to let -- or even encourage -- architecture emerge in its own time and in its own way from the work of the teams. The principle alleges good architecture will come about this way.

Perhaps, but too much risk for me. Good architecture comes from good architects, though they often miss the small stuff on the margin.

Frank Lloyd Wright was a brilliant American architect of the 20th century, but, in almost everything he did, the windows leaked.

The post-WW II suburban "bedroom" towns of the 1950's and 1960's were sprawls of cookie-cutter homes, efficiently built in just a few models that repeated on every street, void of any appealing architecture, and the windows never leaked.

And, so what do we make of this? Is there something actionable here?

Yes: there is a choice to be made, and with that choice an investment and a risk. The choice is whether to pay -- or not -- for good architecture, knowing that its quality is strategic, defining, and discriminating; knowing it will return value many times over.

But, at the same time, the risk is that we are going to have to fix the windows.

Many good architects may get too close to the edge of "it can't be built" as they reach for the discriminating design.


Frank Lloyd Wright was an American architect and interior designer who designed the Solomon Guggenheim Museum in New York City, which is located on the city’s popular Fifth Avenue. Wright was acknowledged in 1991 by the American Institute of Architects as being the greatest American architect of all time See: www.constructionmanagementschools.net/blog/2010/10-essential-architects-of-the-twentieth-century/

Read in the library at Square Peg Consulting about these books I've written
Buy them at any online book retailer!
http://www.sqpegconsulting.com
Read my contribution to the Flashblog

Monday, May 12, 2014

War room boards aplenty


I had an agile student describe their war room boards. Overall, it sounds pretty capable to me:
- We have several "boards" that are used to manage items that are tracked for future consideration including:
a) Product Defects - Defects are tracked here for our product team to conduct investigation, validation, and preparation for resolution
b) Product Ideas - This board is intended to keep track of product ideas that clients or employees would like considered for implementation
c) Product Backlog - This board is where items to be developed within the scope of the current product roadmap are stored and prioritized for development

-Our Product Manager, Technical Services Director and other product developers will meet regularly as a team to prioritize what items are included with our quarterly releases as well as any other point releases that we may do
Controls
At a glance, it would see that the defects and backlog need to be boards with some persistence -- that is, under some kind of control protocol so that stuff doesn't wander away

But the "ideas" board looks like it could be a trial balloon space, something more informal, that could ebb and flow with the idea du jour.

Extend to virtual users Of course, how does one extend this to virtual users? Just because there are several boards doesn't really make the solution any different than if there were only one.

Naturally, an electronic database jumps to mind, one in the cloud accessible to all. Certainly, the protocols for both "adds" and "deletes" as well as "updates" will need to be extened via the cloud as well

Extend to dashboard
Now, if this stuff is in a database, then extension -- with processing and interpretation -- is extendable to a dashboard, suitable for both functional and technical managers.


Read in the library at Square Peg Consulting about these books I've written
Buy them at any online book retailer!
http://www.sqpegconsulting.com
Read my contribution to the Flashblog

Friday, May 9, 2014

To concede, or not


When you make a concession, it's because you are compelled by circumstances; when I make a concession, it's because I see the outcome being in my strategic interest
Anonymous

Another way to put this: "Glass half full (my strategic advantage); glass half empty (your tactical disadvantage)

In the vernacular of these sorts of things, our author shows the difference in "framing" the issue, buying or selling the idea.

And, not only is framing a tool for setting up a buy/sell transaction, but frames are used to illustrate ownership and responsibility on one side, and arm chair quarterbacking on the other. In this case, we often say: "Where you stand depends on where you sit", or "Talk is cheap".

If you are doing this stuff with OPM (other people's money), then taking responsibility may well change your frame. You can't just talk it... you have to do it.


Read in the library at Square Peg Consulting about these books I've written
Buy them at any online book retailer!
http://www.sqpegconsulting.com
Read my contribution to the Flashblog

Wednesday, May 7, 2014

ROI etc and Business Benefits


It's tricky
ROI is a tricky matter, though it seems simple enough:
ROI: Net improvement in a ratio with the required investment for generating the improvement.  

But when the "returns" are not monetized -- as they commonly are not in the public sector and non-profits, for example -- evaluating the numerator is not straightforward at all. And, in some cases even the "investment" is not monetized: What's the value of volunteer labor, insight, and experience? And, what's the value of donated environment -- facilities, tools, and the like?

The larger question: how do you evaluate project ROI when there's no real balance sheet entries for "R" and "I"?

And, ROI is a tricky matter even if you have a monetized balance sheet.  Beware of the tricks and traps: Labor -- aka members of the staff, SMEs, leaders, and managers -- is carried as a liability!  Ooops. Perhaps the HR folks and the CFO folks are not drinking the same water!

Keep it simple
Thus, some make ROI as an exclusively financial metric that may/may not apply in a particular situation. When there's no monetized ROI, then a "return of benefit" may be a better idea.

Benefit, used this way, could be monetized but more likely it's what you get out of the opportunity or the demand, having invested in some way. And, the investment may not be monetized either.

So ROB (return on benefit) can not in general be a ratio since there are not metric units that are compatible for forming a ratio. Consequently, it's common practice to state in functional terms what  you are investing and what you expect to get back/returned.

It's never simple
And, to complicate matters, the ROI or NPV (net present value) or EVA (economic value add) may all be unfavorable, but yet the benefit essential to business success. Thus, the project focus turns to minimizing risk to return of benefit long term, while also minimizing the risk of financial impact insofar as possible.

Of course, I wrote a whole book on this business of getting value from the project


Read in the library at Square Peg Consulting about these books I've written
Buy them at any online book retailer!
http://www.sqpegconsulting.com
Read my contribution to the Flashblog

Monday, May 5, 2014

More on virtual teams


“Virtuality is found in how team members work, not in where team members work.” Thomas P. Wise


I picked up that bit from a book review posting of "Trust in Virtual Teams" by Thomas P. Wise.
Translation:
  • Geography
  • Communications
  • Culture
By Wise's take, those are the main determinants of whether a team is really virtual.

What I think:
I line up big time on the culture thing. I've always said: You can't push culture through the Internet cable all that well. Commonly, you've got two identities: Remote and Local. And each identity has a personality and behavior that fits the either the local or remote culture. (Will the "real" you come forward?)

But, the the others are important. For instance, working from home a day a week pretty much means just a geographic separation: you're not going to lose your culture (beliefs and norms) in just a day at the house. But, given enough time in a remote geography, and you're going to "go native" as they say.

And, of course, if you can't effectively communicate, then there goes the body language and probably half your communications input.

But, these are my ideas; for Wise's take, read the book.


Read in the library at Square Peg Consulting about these books I've written
Buy them at any online book retailer!
http://www.sqpegconsulting.com
Read my contribution to the Flashblog

Friday, May 2, 2014

Capital efficiency in large scale construction


Need a checklist of what to consider when evaluating capital requirements for a large scale construction project -- like say replacing the Golden Gate Bridge?

Bob Prieto has just the one for you, and only 21 pages!  Bob writes:
Large capital construction projects in both the industrial and infrastructure sectors are challenged today in three significant ways:
 1. Capital efficiency of the project – this considers both first costs as well as life
cycle costs
 2. Capital certainty – reflecting execution efficiency, predictability and effective risk transfer through appropriate contracting strategies
 3. Time to market – perhaps best thought of as schedule certainty but also accelerated delivery of projects, often an essential ingredient in capital efficiency

This paper focuses on achieving improved capital efficiency in large capital asset projects through the adoption of an expanded basis of design that considers all aspects of a capital asset’s life cycle
In this paper, Bob focuses on Capital Efficiency.

And he discusses the whole life cycle; he makes a distinction between development costs, post-project sustainability, and post-project O&M, though frankly the difference between these last two appear a bit fuzzy to me. Taken together, they represent the life cycle costs, unless you want to throw in salvage at the end. (Would we ever budget salvage end of life for the Golden Gate?)

Even if you're not in construction, this is a handy checklist for the large scale among us.


Read in the library at Square Peg Consulting about these books I've written
Buy them at any online book retailer!
http://www.sqpegconsulting.com
Read my contribution to the Flashblog