Friday, November 28, 2014

Agile stats from Scott Ambler


We're always looking for some agile statistics to see how things are going. Here's some decent stuff from Scott Ambler, an agile thinker, author, practitioner of some renown.

I heard Ambler give this live at a PMI presentation in Orlando recently. He's pretty animated when he talks live, so some of the energy of presentation may be missing from just the slides.

I was struck by a couple of things he said (to 100 PMPs assembled at dinner):
  • In 10 years most of what we think of as project management will be gone... some management will be around, but not like we know it. This didn't do much to motivate the room of PMPs to move to agile.
  • Agile in the main is a risk management strategy (I've been saying that for years, so nice to get some validation)
  • All serious agile is a hybrid that marries up traditional swim lanes (see page 23) ... ditto my thoughts on agile in the waterfall
  • Beware: pilot projects often don't lead to successful general purpose agile teams because there's too much optimization in pilots ... probably true
  • It could take years to transition a large scale enterprise to agile... OMG, that sounds awful... but probably true, unless you just sweep out all the people and start over... it happens.

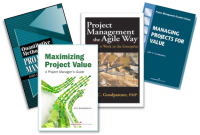
Read in the library at Square Peg Consulting about these books I've written
Buy them at any online book retailer!
http://www.sqpegconsulting.com
Read my contribution to the Flashblog
Wednesday, November 26, 2014

Growth, maturity, and decline


A common sequence studied by change managers -- particularly business change managers -- is the so-called growth-maturity-decline triad.

PMs experience the effects of this sequence more in the business case than in the actual project. After all, it takes a good deal of time to go through the business cycle; and it's not inevitable that the entire sequence ever comes about since managers intervene to redirect the business.

And, the public sector is not immune: Agencies can go out of business, declining as constituent demands declines or gives up; and agencies can re-invent themselves for new constituent demands (it's not your grandfather's motor vehicle department, or bus line, etc).

And, of course, there can be new agencies born of necessity of a changing public demand -- who remembers that in the U.S. conservative Republicans invented the Environmental Protection Agency in the Nixon administration, or the liberal Democrats invented the CIA, in the Truman administration? Now, How the world turns, etc and so on....

So, how does growth-maturity-decline look when viewed through the lens of projects?

Business case: Low cost of ownership
The real test between maturity and decline is whether or not there is new investment going into the business. In the decline stage, the emphasis is on cost control, efficiency, and getting the most out of existing product with existing customers; there's little or no investment beyond required maintenance.

Over time, product will obsolesce and customers will move on.

Business case: New customers for existing product base
If there's investment going into finding new customers with existing product, that's probably a mature organization surviving. 

Business case: New product, but directed to new customers
Growth investment is going into both customers and product, keeping both fresh and competitive.

And, here's a challenge question: when is an expenditure a cost and when is it an investment? Sponsor attitudes are usually quite different depending on the view point.

My answer: It's an investment when it goes toward making the future different from the present; that is: it's aimed at strategic differentiation -- to wit start-up and growth. Else, it's a cost required to keep things moving along as in the present for maturity and decline.

People and things
And, you can extend the argument to people: the CFO carries people on the liability side of the balance sheet -- creditors (they provide time & talent) to whom we owe benefits, salary, etc.

But, what if you're out to hire the one best person to do a task and make a strategic difference toward growth? Investment (asset) or cost (liability).  If an investment, hopefully you've got their scorecard set up to reflect the ROI demand.


Read in the library at Square Peg Consulting about these books I've written
Buy them at any online book retailer!
http://www.sqpegconsulting.com
Read my contribution to the Flashblog

Monday, November 24, 2014

International culture -- more stuff to know


I've given many presentations in Europe and Asia -- successful I always thought -- but I probably missed the lessons learned as I read Erin Meyer's blog posting about tailoring your presentation to fit the culture of the audience. Myer tells us he ran into some issues in a briefing to a French audience:

"The stonewall [to my briefing to a French audience that] .... was “principles-first reasoning” (sometimes referred to as deductive reasoning), which derives conclusions or facts from general principles or concepts. People from principles-first cultures, such as France, Spain, Germany, and Russia (to name just a few) most often seek to understand the “why” behind proposals or requests before they move to action.

But as an American, I had been immersed throughout my life in “applications-first reasoning” (sometimes referred to as inductive reasoning), in which general conclusions are reached based on a pattern of factual observations from the real world.

Application-first cultures tend to focus less on the “why” and more on the “how.” .


And, so, Meyer sums it up with this advice:
When working with applications-first people:

Presentations: Make your arguments effectively by getting right to the point. Stick to concrete examples, tools and next steps. ... You’ll need less time for conceptual debate.

Persuading others: Provide practical examples of how it worked elsewhere.

Providing Instructions: Focus on the how more than the why.

When working with principles-first people:

Presentations: Make your argument effectively by explaining and validating the concept underlying your reasoning before coming to conclusions and examples. Leave ... time for challenge and debate of the underlying concepts.....

Persuading others: Provide background principles and welcome debate.

Providing Instructions: Explain why, not just how.

Read in the library at Square Peg Consulting about these books I've written
Buy them at any online book retailer!
http://www.sqpegconsulting.com
Read my contribution to the Flashblog

Friday, November 21, 2014

Figure of Merit


"Figure of Merit".... everybody got this, or should I say more?

Some say FoM, of course.

Definition
A figure-of-merit is a metric used to compare like objects or concepts where the metric itself may have no dimension or units of measure (UoM); or the FoM dimension is meaningless for day to day operations. You can also think of a FoM as a weight applied to separate the value or utility of one thing from its peers.

A FoM may have no dimension because it is a ratio of two similarly dimensioned metrics, so the dimensions cancel in the ratio; it may have dimensions that are meaningless  for anything other than that's how the metric got formed -- like days-squared.

Sometimes, when you have no other way to compare something, a FoM, even if you make it up  gives you a way to separate things and make decisions.

Examples
Day to day in the PM domain, we run into a lot of stuff that needs to be compared -- one strategy over another, or one competitor over another, etc -- and there's no one metric that quite does it.

Enter: FoM

You might look at a number of factors and baseline competitor A as a "10" -- a dimensionless FoM. All others are compared to the baseline. If competitor "B" is evaluated as a 20, or some such, and bigger is better, then B is twice as "good" or valuable as A on the basis of a figure of merit.

You might look at the utility of one thing over another. Utility is perceived value; it may not be objective -- quality, like art, is in the eye of the beholder, etc. -- and it may not be functional: what's the perceived value of silver over black? (My wife won't buy a black car .... so, a black car on the sales lot has no value to her )

To look at the utility of something, you give it a score -- a FoM -- probably dimensionless. And, then everything else is compared to it. (Silver gets a 10; black gets a 0)

And then there's the quantitative stuff, like risk variance. Risk is often judged by how far an outcome might be from the accepted norm or average value. But, this implies a direction ... how far in what direction? Maybe it doesn't matter. Perhaps you've got a situation where the direction is immaterial and it's all about distance.

In that case, as in + or - from the average value, the way to get around direction is to square the distance -- now, everything is positive but, alas, the dimension is now squared, as in days-squared.

That's ok, just think of the variance is a FoM: smaller is better! Who actually cares what a days-squared is? Nobody, actually.


Read in the library at Square Peg Consulting about these books I've written
Buy them at any online book retailer!
http://www.sqpegconsulting.com
Read my contribution to the Flashblog

Wednesday, November 19, 2014

What's the return on diversification?


Can you work this problem?
You've got something big to do -- a project or task -- and it has risk and uncertainty. Some of the estimates are way pessimistic, and some are actually more optimistic than you think the average outcome should be. So, the variance -- a figure of merit for how far the various estimates differ from the mean -- is quite large

You decide to divide the big thing into several smaller units -- say, N units -- so that you've got better visibility into each unit than trying to deal with one big thing, and the risks don't affect all units the same way. In fact the risks of the smaller units are now pretty much isolated one from the other

How much better is the overall variance of your project? In other words are N smaller units less risky overall than the one big thing before it was divided?


Answer: the overall risk is lower; the total variance of the project, calculated as the sum of all the variances of the smaller units, is lower than the variance of the one risky "big something" before dividing it up.

However, the total average value is unchanged; you didn't change the size of the pie; you just sliced it up.

If think of variance as a figure of merit for risk, how less risky is the overall project after dividing the big thing by N? Actually, it's pretty close to 1/N. That is, the sum of the variances of the smaller units is about 1/N the variance of the larger unit.

Diversification:
I've been writing about a functional description of the diversification rule: If you divide a risky thing into N smaller things; with risks independent between the smaller things; the overall risk -- defined as the variance from the mean value -- is lower by about 1/N

So, what things in the project domain could benefit from the rule? How about: personal or business investments, tasks, and portfolios?  All are all candidates for diversification.

Student:
"I understand this from a conceptual point of view. It makes sense. But is there a way to calculate the point of diminishing returns [of dividing things up]?

Obviously, this can be overdone and then we have so many smaller tasks that we spend more time updating action item lists and other project artifacts than getting things done."

Instructor:
Quite right, there is a trade between managing the variance (range of risk impacts) and managing the overhead (See: anti-lean, non-value add) of smaller units. There's no calculation per se; it's a matter of judgment and circumstance.

Typically, a work unit would not be smaller than a couple of weeks duration, and the scope is typically not smaller than what a handful of people can do in those couple of weeks.

That said, overhead is one of those things that usually does not scale linearly -- control and monitor costs are often unrelated to the nature of the content and often poorly correlated with the scope of the content. Example: the time and cost of making earned value calculations matters not a wit what the scope is about, or how big it is, or what it costs.

Of course, you could look at the actual overhead costs and compare them with the cost (impact) of the risk and decide which is the lesser cost, but only if the risk impact is strictly monetized [apples to apples comparison]

When the risk impact is not monetized, then you are into a qualitative judgment that only you can decide how big N should be.


Read in the library at Square Peg Consulting about these books I've written
Buy them at any online book retailer!
http://www.sqpegconsulting.com
Read my contribution to the Flashblog

Friday, November 7, 2014

$10 words in risk management


When you get into risk management a bit, there are some biggies that get thrown around -- I call them $10 words -- and there are two that more or less divide risk management along the lines of
  1. The unknown that is possibly knowable with some legwork
  2. The unknown that is likely to remain unknowable
First case
For the first case, this is all about knowledge, the nature of knowledge, and how better to improve knowledge. Generally, this is called "epistemology" (ka-ching: $10 please) -- understanding the nature and scope of knowledge.

Risks that are subject to a better understanding by simply (I say simply, but often it's not simple) digging out more information are called "epistemic risks"

More simply yet, epistemic risks are those you can do something about -- they are actionable by nature of greater understanding and knowledge development.

In other words, epistemic risks are those for which the uncertainty can reduced -- if you spend the money to try.

And here's another opportunity to make $10: epistemic risks can be set in an organized framework of knowledge, said knowledge frameworks are called ontologies, and so epistemic risks are sometimes called ontological risks (OMG! this just gets better and better)

Second case
For the second case, it's all about the hidden, latent, unknowable (you may not find out what you don't know to ask, etc) that just happens by chance. For example, games of chance, like dice, you simply have no way of knowing what is going to come up next. There's no question you can ask to find out. And, the games are "memoryless" and thus independent; the former outcome has no bearing -- seemingly -- on the next outcome.

Such risks are called aleatoric risks, from the word aleatory meaning "related to random choice or outcome"

The good news, if there is any, is that aleatoric risks have probability distributions that is quantitative description of their random outcomes. If you can discover something about the distribution, you have something to work with re mitigating effects.

Operationally, you can't really reduce the uncertainty surrounding aleatoric risks, but you can immunize your project to the random or chance outcomes -- within limits of course -- by providing slack, buffers, redundancy, loose coupling, etc. In other words, to make the project less fragile and susceptible to the shock of a such a risk outcome.


Read in the library at Square Peg Consulting about these books I've written
Buy them at any online book retailer!
http://www.sqpegconsulting.com
Read my contribution to the Flashblog

Wednesday, November 5, 2014

Vanity metrics


Vanity Metrics: Actually, until recently, I had not heard of vanity metrics, aka VM. Now, I am writing about them! Does that make me a VM SME?...

So, some definition, as given to us by VM inventor Eric Ries, as posted at fourhourworkweek.com

The only metrics that entrepreneurs should invest energy in collecting are those that help them make decisions. Unfortunately, the majority of data available in off-the-shelf analytics packages are what I call Vanity Metrics. They might make you feel good, but they don’t offer clear guidance for what to do.

So, some examples -- as cited my Mike Cohn in an email blast about Reis' ideas:
Eric Ries first defined vanity metrics in his landmark book, The Lean Startup. Ries says vanity metrics are the ones that most startups are judged by—things like page views, number of registered users, account activations, and things like that.

So, what's wrong with this stuff? VMs are not actionable.. that's what's wrong. The no-VM crowd says that a clear cause-and-effect relationship is not discernible, and thus what action (cause) would you take to drive the metric higher (effect)? Well, you can't tell because there could be many cause, some indirect, that might have an effect -- or might not. The effect may be coming from somewhere else entirely. So, why waste time looking at VMs if you can't do anything about it?

Ries goes on to tell us it's all about "actionable metrics", not vanity metrics. AMs are metrics with a direct cause and effect. He gives some examples:
  • Split tests: A/B experiments produce the most actionable of all metrics, because they explicitly refute or confirm a specific hypothesis
  • Per-customer: Vanity metrics tend to take our attention away from this reality by focusing our attention on abstract groups and concepts. Instead, take a look at data that is happening on a per-customer or per-segment basis to confirm a specific hypothesis
  • Cohort and funnel analysis: The best kind of per-customer metrics to use for ongoing decision making are cohort metrics. For example, consider an ecommerce product that has a couple of key customer lifecycle events: registering for the product, signing up for the free trial, using the product, and becoming a paying customer

Now, it's time to introduce my oft cited advice: Don't confuse -- which is actually easier to write than to do -- cause-effect (causation) with correlation (coordinated movements, but not causation)
  • Causation: because you do X, I am compelled (or ordered, or mandated) to do Y; or, Y is a direct and only outcome of X. I sell one of my books (see below the books I wrote that you can buy) and the publisher sends me a dollar ninety-eight. Direct cause and effect; no ambiguity. Actionable: sell more books; get more money from the publisher.
  • Correlation: when you do X, I'll be doing Y because I feel like doing Y, but I could easily choose not to do Y, or choose to do Z. I might even do Y when you are not doing X. Thus, the correlation of Y with X is not 100%, but some lesser figure which we call the coefficient, typically "r". "r" is that part of the Y thing that is influenced consistently by X
So, what is the actionable thing to do re X if I want you to respond Y? Hard to say. Suppose "r" is only 2/3'rds. That means: 2 out of three times you'll probably respond to X with Y, but a third of the time you sit on it .... or do something else I don't care about. Bummer!

Here's my bottom line: on this blog, I watch all the VM analytics... makes me feel good, just as Ries says. But I also look at the metrics about what seems to resonate with readers, and I take action: I try to do more of the same: AM response, to be sure.

I frankly don't see the problem with having both VM and AM in the same metric system. One is nice to have and may provide some insight; one is to work on!


Read in the library at Square Peg Consulting about these books I've written
Buy them at any online book retailer!
http://www.sqpegconsulting.com
Read my contribution to the Flashblog

Monday, November 3, 2014

Achievement but tragedy


"Humanity's greatest achievements come out of our greatest pain"

Richard Branson

An eloquent statement, surely

One is drawn to think of other projects gone tragically off track ... Apollo 1 perhaps more intense, but like Apollo this program will go on as well.


Read in the library at Square Peg Consulting about these books I've written
Buy them at any online book retailer!
http://www.sqpegconsulting.com
Read my contribution to the Flashblog