Thursday, May 2, 2013

The death of statistics?


Normal Deviate (thoughts on statistics and machine learning) is not a site I go to for the usual fare about project mangement, risk management, and the like, but with a provocative lead like "the death of statistics" I decided to read on...

As you might imagine, about the death of statistics we can say: Not exactly!

The issue seems to be all about the lastest meme, "big data" -- or in some quarters: "data science". With data warehouse projects and ERP projects, to say nothing of other "big science" projects (map the human brain?), project managers run into this stuff a lot. So, what is data analysis in the context of big data? What are we doing when we do data science?

These may not be the burning questions of the day, but we learn that Karl Broman -- who blogs at "The stupidest things -- statistics, genetics, programming, academics", is really wound up on this issue. He writes:

When physicists do mathematics, they don’t say they’re doing “number science”. They’re doing math.
If you’re analyzing data, you’re doing statistics. You can call it data science or informatics or analytics or whatever, but it’s still statistics.
If you say that one kind of data analysis is statistics and another kind is not, you’re not allowing innovation.

 
Of course,  Mr Broman got some pushback from some of his readers. In particular, we saw this reply from Hillary Parker at "No so standard deviations":
"OK but… as you point out, physicists do mathematics, but still call themselves physicists because that’s not all they do.
Whether or not you agree, data scientists would qualify themselves the same way — they do statistics, but also other things that statisticians generally do not do (product development, system administration, engineering, etc.).
 
I guess I'm with Ms Parker on this one... project managers do statistics (or get their project analysts to do stastistics for them) but still call themselves PMs or analysts....


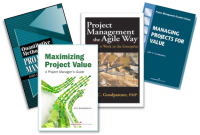
Check out these books I've written in the library at Square Peg Consulting
Tuesday, April 30, 2013

Changing the RMP exam


If you're thinking about taking the RMP exam for risk management credentials from PMI, you should be aware that the test content will change in August, 2013.

PMI has recently completed a RDS (Role Delination Study) for the RMP. A FAQ on this RDS is useful reading if you are headed for the test this year.

PMI has updated the outline of the RMP test content, adding one domain (now five) for testing and expanding the tasks within domains to 31.


Take note: the five domains vis a vis the RMP exam are not mapped to the six process steps of the risk management knowledge area in Chapter 11 of the 5th Edition to the PMBOK Guide. This is something you would have to do for yourself if you want to get the relationships here.

And, by the way, the 5th Edition is the one to study for the test. (Don't forget the PMI Practice Standard for Risk Management, a new version of which has not been published)


Check out these books I've written in the library at Square Peg Consulting

Sunday, April 28, 2013

Book review for Maximizing Project Value


Shim Marom, who blogs at quantmleap.com, recently reviewed my latest book "Maximizing Project Value".

And, Glen Alleman has a "first look" review as well.

Every author is grateful for a critical review, and I'm no different. You'll find not only a review of my book, but thoughtful reviews of a number of books at quantmleap.com.

Of course, in keeping with the state of the art in the book business, you can get this book in paper, Kindle, and google ebook format.


Check out these books I've written in the library at Square Peg Consulting

Friday, April 26, 2013

NIST Cyber framework


Here's an FYI for those with projects in the cyber security domain:

The National Institute of Standards and Technology (NIST) is holding the second of four planned workshops to develop a voluntary framework to reduce cybersecurity risks for critical infrastructurefrom May 29-31, 2013, at Carnegie Mellon University in Pittsburgh, Pa. The hands-on workshop is open to cybersecurity industry experts in all sectors—such as energy, finance, transportation and communications—as well as government and academic stakeholders.

The second workshop on the Cybersecurity Framework will be an opportunity for attendees to identify, refine, and guide the many interrelated considerations, challenges, and efforts needed to develop the Framework. The majority of the workshop will be working sessions where participants will analyze and discuss the initial inputs to the Framework...


Check out these books I've written in the library at Square Peg Consulting

Wednesday, April 24, 2013

Statistics before calculus... really?


Arthur Benjamin -- a math teacher -- posits that calculus, as the pinnacle of the mathematics pyramid is the wrong goal. Rather, it should be statistics. He profers that statistics are the math of daily living: randomness, uncertaintly, risk, reward, even games! It's the math we communicate with more often than calculus (even if many use calculus in daily living and don't know they are doing so)

Here's his argument in less than 3 minutes:


Check out these books I've written in the library at Square Peg Consulting

Saturday, April 20, 2013

Systems engineering FAQ

A lot of PMs know they need systems engineering, or think they might, but aren't sure who these folks are or what they do.

Here's my FAQ I used when I was a Director for systems engineering for aerospace and communications firm Harris Corporation.

(And, I tried to make this not to stuffy!)


What is this thing called system engineering?
  • What is system engineering? Here's the way NASA defines it: "System engineering is a methodical, disciplined approach for the design, realization, technical management, operations, and retirement of a system"
  • What do systems engineers  (SE) do? Primarily, they have three work areas: system architecture; system feature, function, and performance; and system validation. Included in these three work areas are the system 'ilities', system risk management, major interfaces, and optimization among competing constituents. And, SEs contribute to the major project plans as directed by the PMO. 
  • Why is system validation one of their responsibilities? First, SEs are independent of the developers -- and independence is a good thing for validation. Second, the SE is charged with maintaining a holistic view of the system; this view should inform system validation procedures. And, third, this puts accountability into the mix: SE is actually in the workstream that makes it work!
  • Are there standards and protocols for what SEs do? Yes, like the body of knowledge for project management, there is a generally accepted body of knowledge for SEs. For instance,  INCOSE -- the SE counterpart to PMI or APM -- maintains a body of knowledge in their System Engineering Handbook. Among free resources are those in the public domain from the US DoD/SE and NASA.  Of course, there's also the ISO standard 26702, among other ISO standards on various disciplines with SE.
There's always the planning issues:
  • Do SEs have their own workpackage or swim lane? Yes, it's customary to uniquely track cost, schedule, and deliverables of the SE activity
  • Who do they report to? Typically, SE reports to the PMO
  • What's a good benchmark for cost? Benchmarks depend on the nature of the project. For studies, the SE could be the whole project; for a typical development with a generous system validation activity, SE could be as much as 40% of the cost, but probably not less than 8%.
  • Do they have deliverables? Yes, SE is not a level-of-effort; the deliverables depend on the specifics of the project, but for the most part they are plans, specifications, and procedures.
I get questions on this stuff also:
  • If SE are the architects, what is architecture? Architecture is that which defines/specifies/describes the overall boundaries of the major components and defines/specifies/describes the interrelationships and behaviors among the components. In some situations, the overall physical appearance and presentation may be part of the architecture
  • What are they thinking when a SE talks about a system? I've answered this before, but here's the simple answer: a set of 'things' -- constituents -- interconnected in such a way that they produce their own pattern of behavior over time. The way a system responds to stimulus is a characteristic of the system itself and not necessarily that of any of its constituents
  • Should I use SEs to pursue new business? Yes, many have good customer skills and can communicate conceptually to the thinkers in the customer community
  • Can I innovate without them? Anyone can be the innovator, but SEs are often cast in the role of coming up with unique and discriminating ways to do things.
And, of course, there's always the questions to end on:
  • What do I give up if I don't have them? Many projects don't have a SE per se and do just fine. However, on larger projects with complexity and scale, the architecture function is essential. If not an SE, then someone else with that role is needed for the activity
  • If my project team does this anyway aren't just redundant? Not really; they bring a mindset, attitude, bias, and skill that is unique to the SE tradecraft.

Thursday, April 18, 2013

Storytelling with 'big data'


Jeff Bladt and Bob Filbin wrote a concise post at HBR.org about the way they go about applying big data in their business. Their idea:
A Data Scientist's Real Job: Storytelling
 
Data is dull; information may be interesting; but stories can be captivating.
It's sales 101: there's the messenger and there's the message. The combination, well made, is what gets the point across.

Authors Bladt and Filbin are talking about how to analyze and present information from a data warehouse or other large repository of data.

They've devised a process in three steps:
  1. Look only for data that affect your organization's key metrics
    This seems obvious on the face of it, but confusion, ambiguity, and incoherence affect all too many data analyses. Look to the business scorecard and/or the project scorecard for the key metrics (a.k.a. Key Performance Indicators, KPI) that really count
  2. Present data so that everyone can grasp the insights
    As the authors say: "...never show a regression analysis or a plot from R. In fact, our final presentation had very few numbers
  3. Return to the data with new questions"
    This step is continuous improvement -- CI -- applied to storytelling, using feedback from the audience to refine the story and find new chapters
Project management effect
From the project management perspective, these data stories may well come around as requirements. The agilists will handle them as 'user stories' and use cases -- maintaining the conversational character. The traditionalists will structure them into 'shalls' and 'wills'.

Here's my take:
The popular vernacular is 'narrative'. So in the context of data, what's a narrative? Simply said, it's discreet facts -- call them 'data dots' -- sequenced, related, and linked in such a way that a theme emerges and a story -- a narrative -- is evident: a beginning, middle, and ending. In other words, the dots are connected.

Usually, there's a self-evident purpose for constructing a specific story from the data dots, though it's likely that more than one narrative is possible. Just put the dots back in the pot, draw them out again, and connect them differently: same facts, different story!

In any event, the good news for the project is that there is a data source to go back to; the bad news is it's not stationary, subject to updates from business operations.

But data changes...
The project might want to think about capturing a data image and putting it away as a 'static' version. This image capture can be the baseline for requirements.  And, even though static, if accessible by an project analysis engine, the project can continue to probe for derived requirements

Check out these books I've written in the library at Square Peg Consulting